A Guide to Quantitative NMR (qNMR)
Quantitative NMR (qNMR) stands as a robust method for gauging pharmaceutical purity. In the realm of analytical chemistry, nuclear magnetic resonance (NMR) spectroscopy emerges as a potent technique, offering insights into the structure, dynamics, and interactions of organic molecules while enabling quantitative measurements. A pivotal distinction from other methods lies in the direct proportionality between the integral of an NMR peak and the nucleus concentration.
This unique feature positions NMR as a highly valuable tool for precise quantification. However, this potency is contingent upon meticulous measurement execution and careful spectrum processing. This blog post delves into the intricacies of quantitative NMR, addressing challenges and highlighting key applications in pharmaceutical analysis.
qNMR appears simple at first glance. It only requires the sample to dissolve completely in a deuterated solvent and to contain NMR-active nuclides. By measuring the intensity of NMR signals we can determine the concentration of products and impurities in a solution. We will see that it is not that simple at all.
In this blog post, we will primarily focus on quantitative 1H NMR. The reason is that this is by far the most popular method since 1H nuclei can be found in almost all organic molecules, and it has well-known advantages:
- highest gyromagnetic ratio amongst stable NMR active nuclei.
- natural abundance is 99.99%.
- short relaxation times (usually below a few seconds).
The process of a qNMR measurement can be divided into 4 steps:
- Method Planning
- Sample Preparation
- Data Collection
- Data Processing
Method Planning
Selecting a solvent where both the analyte and the internal standard dissolve is necessary but not sufficient. Accurate concentration determination mandates calculating the integral of an analyte peak, ensuring non-overlapping peaks with the internal standard. Addressing solvent-dependent chemical shifts, caused by differences like CDCl3 versus benzene-d6, requires trying different solvents or adjusting conditions such as temperature or pH. Unambiguous assignment of the analyte NMR signal is crucial to prevent impurity signals from being hidden. The chosen internal standard should be non-reactive, possess validated purity, and demonstrate stability. Certified standards for qNMR often provide 1H spectra for suitability assessment. Optimal accuracy and precision are achieved with high-quality NMR tubes compatible with the magnetic field strength. Higher magnetic fields in qNMR enhance sensitivity and signal dispersion. Choose the simplest pulse program, like zg, and exercise caution with receiver gain settings to prevent peak distortion and potential errors.
In cases where an internal standard is not feasible or appropriate, an external standard can be employed for accurate concentration determination in quantitative NMR (qNMR) analysis. An external standard is a compound of known concentration that is added to the sample prior to analysis. Its concentration is precisely known and ideally matches the analyte's chemical environment and concentration range. The external standard is typically placed in a separate insert within the NMR tube, ensuring it does not mix with the analyte solution but remains within the same magnetic field during measurement.
Sample Preparation
For NMR measurements, a microbalance with a 0.001 mg read-out is essential for accurate weighing of the typically used few milligrams of the sample. To prevent weighing errors, employ an anti-static kit, use a plastic spatula instead of metal, and avoid glass vials.
When weighing, aim for an analyte amount providing a sufficient signal-to-noise (S2N) ratio, avoiding overly high concentrations to prevent extensive molecular interactions complicating the NMR spectrum. Generally, 10-20 mg suffices for small molecules. While analyzing expensive samples allows lower amounts, consider that S2N is inversely proportional to the square of the number of scans—four times more scans result in twice the S2N.
Strive for a 1:1 intensity ratio between peaks of the analyte and the internal standard for integration accuracy. Ensure sample homogeneity for proper magnet shimming, avoiding broad signals and severe overlap caused by inhomogeneities. Choose a low-water-content solvent to prevent signal-related distortions. For repeated use of an internal standard, especially in low concentrations, opt for a stock solution, adding it to the analyte with a Hamilton syringe to minimize pipetting errors.
Data Collection
This blog emphasizes a crucial statement: "The integral of an NMR peak is directly proportional to the concentration of the nucleus giving rise to the peak," represented by the equation I = kN, where I is the integral, N is the number of nuclei, and k is the spectrometer constant encapsulating the NMR setup. To ensure the validity of this statement, certain criteria must be met.
Uniform pulse excitation across the spectral width, typically achieved with modern electronics providing short 10 µs 90° pulses, is vital. It is advised to measure the spectrum within a window extending approximately 1 ppm upfield and downfield from the respective spectrum ends, aiding in baseline corrections. High signal-to-noise ratio (S2N) is essential for integration accuracy, with a suggested S2N of 250 for precision better than 1%, often requiring multiple scans.
Between scans, waiting time for nuclei to relax, approximately 7 times the T1 (spin-lattice relaxation time) of the nuclei of interest, ensures thermal equilibrium. Measuring T1 relaxation time can optimize the delay (d1) in the pulse sequence, with recommendations based on the longest T1 of signals of interest. Adequate setting of acquisition time (aq) ensures FID decay completion, preventing truncation and spectral inaccuracies. Use of 90° pulses is recommended for qNMR measurements, a topic explored in detail in another blog post. Conducting multiple parallel measurements enhances method reproducibility. Despite numerous conditions, precise and accurate qNMR spectra are achievable if parameters align with recommended guidelines, affirming the method's robustness and reliability.
Data Processing
Careful processing of the measured Free Induction Decay (FID) is crucial. Despite significant advancements in NMR spectra processing applications, manual processing is still recommended for precision. Applying zero filling enhances line definition, and minimal line broadening (0.1 Hz) is advised to retain narrow signal half-widths. Phase and baseline correction are essential, as incorrect phasing or baseline adjustment can distort integral values.
Decisions must be made regarding the integration of peaks with or without 13C satellites, with consistency across all integrated signals crucial due to the additional 1.1% introduced by these satellites. To capture 99% of the entire signal intensity, extend integration over a frequency range equivalent to 64 times the full width at half height (FWHH) value. For instance, a 2 Hz line requires integrating a 128 Hz window.
With the integral values, we can calculate the purity of the analyte using the following equation:
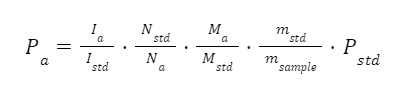
where P is the purity, I is the integral value, N is the relative number of protons giving rise to the peak, M is the molar mass and m is the mass, while “a” corresponds to the analyte and “std” for the standard.
Potential Applications
Quantitative NMR proves to be a valuable tool for assessing the purity of small molecules, offering a spectrum with clear signal separation.
In drug analysis, qNMR is pivotal for drug formulation, ensuring accurate dosage of active pharmaceutical ingredients (APIs), monitoring reaction progress, and verifying the purity of pharmaceutical products.
The application of qNMR extends to the analysis of food and beverages, encompassing tasks such as determining sugar content in beverages, verifying the authenticity of honey and wine, and assessing the fatty acid composition of oils.
In the realm of moisture and air-sensitive molecules, qNMR stands out. Utilizing screw-cap NMR tubes allows samples to be prepared within a glove box and measured in an inert environment—an advantage not feasible with other high-resolution techniques like mass spectrometry. For relative quantification without an internal standard, qNMR excels in quantifying diastereomer ratios.
The versatility of qNMR is further evident in its application for quantifying natural products and forensic analysis.
qNMR Advantages
Let's compare qNMR with the widely used quantification tools, such as gas chromatography (GC) or liquid chromatography (LC).
In most detectors, creating a calibration curve is essential, ideally using the same compound as the analyte. This curve correlates measured signal intensities with concentrations, requiring time-consuming processes of preparing solutions in various concentrations, measuring, processing, and periodic remeasurement. Unlike chromatography, NMR, being inherently quantitative, doesn't necessitate a calibration curve. NMR allows simultaneous measurement of all components in the mixture.
However, qNMR has limitations, particularly with complex mixtures due to signal overlap. Opting for nuclei other than 1H, like 19F, can enhance signal dispersion but might slow down the NMR experiment due to its relatively low sensitivity. In summary, chromatography is generally more cost-effective and quicker than qNMR. Yet, qNMR's direct and linear response, high precision with low uncertainty, and inert nature offer distinct advantages.