Bioanalytical Assay for Poloxamer Detection
Why is it crucial to develop bioanalytical detection assays for poloxamers?
Amphiphilic copolymers have been gaining significant attention due to their ability to simultaneously perform as both a hydrophilic and hydrophobic polymer. The hydrophilic moieties are responsible for water solubility and creating a suitable interface with the aqueous environment of biological tissue, while the hydrophobic moieties are responsible for adsorbing onto hydrophobic sites.1 This “dual nature”characteristic is what enables these polymers to recently find use in several clinical applications, including gene therapy, gene (DNA) delivery, and as therapeutic excipients.2

Poloxamers are non-ionic, poly(ethylene oxide) (PEO)–poly(propylene oxide) (PPO) copolymers, which have been extensively used in the pharmaceutical industry. As shown in the figure below, poloxamers are tri-block copolymers which contain three polymers subunits that are sequentially linked by covalent bonds. Different types of poloxamers possess a similar polymer backbone, but have different molecular weights due to the number of hydrophilic (PEO) and hydrophobic (PPO) polymer subunits.3 For example, P-188 contains 80 subunits of PEO and 27 subunits of PPO, whereas P-338 contains 141 subunits of PEO and 44 subunits of PPO.


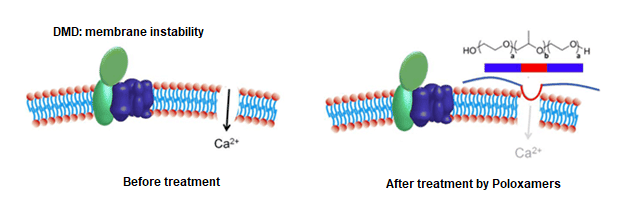
Recently, the bioanalytical team at Emery Pharma has engaged in multiple projects that focused on poloxamers used as new therapeutics. Poloxamers have shown promising results as a therapy for Duchenne Muscular Dystrophy (DMD), a devastating progressive disease of muscle membrane instability that leads to striated muscle deterioration. In this application, poloxamers has been shown to stabilize the membranes of dystrophic myocardium in animal models (see figure below).4
Despite the wide range of poloxamer applications, limited bioanalytical techniques have been reported in the literature that describe how to quantify poloxamers at trace levels. In order to obtain the desired sensitivity, accuracy, and precision in accordance to FDA guidelines, it is essential to develop a highly robust and sensitive bioanalytical assay for the quantification of poloxamers.
Size-exclusion, liquid-chromatographic-based assays with evaporative light scattering detection (ELSD) have been commonly employed to quantify poloxamers in biological samples. However, the results from these methods exhibit poor sensitivity, poor reproducibility, and non-linear detection. Another technique used is electrospray ionization-mass spectrometry (ESI-MS), but due to complexities of poloxamers, the assay suffers from poor ionization efficiency as well as poor sensitivity.5
To developing a more robust and more sensitive mass-spectrometric-based analysis, it is crucial to address the shortcomings of the current assays. Over time, our team of bioanalytical scientists at Emery Pharma has developed a highly robust, highly sensitive LC-MS/MS method to quantify poloxamers in biological samples. Part of the method employs a protein precipitation extraction protocol to extract poloxamers from biological samples prior to LC-MS/MS analysis, depicted in the figure below.
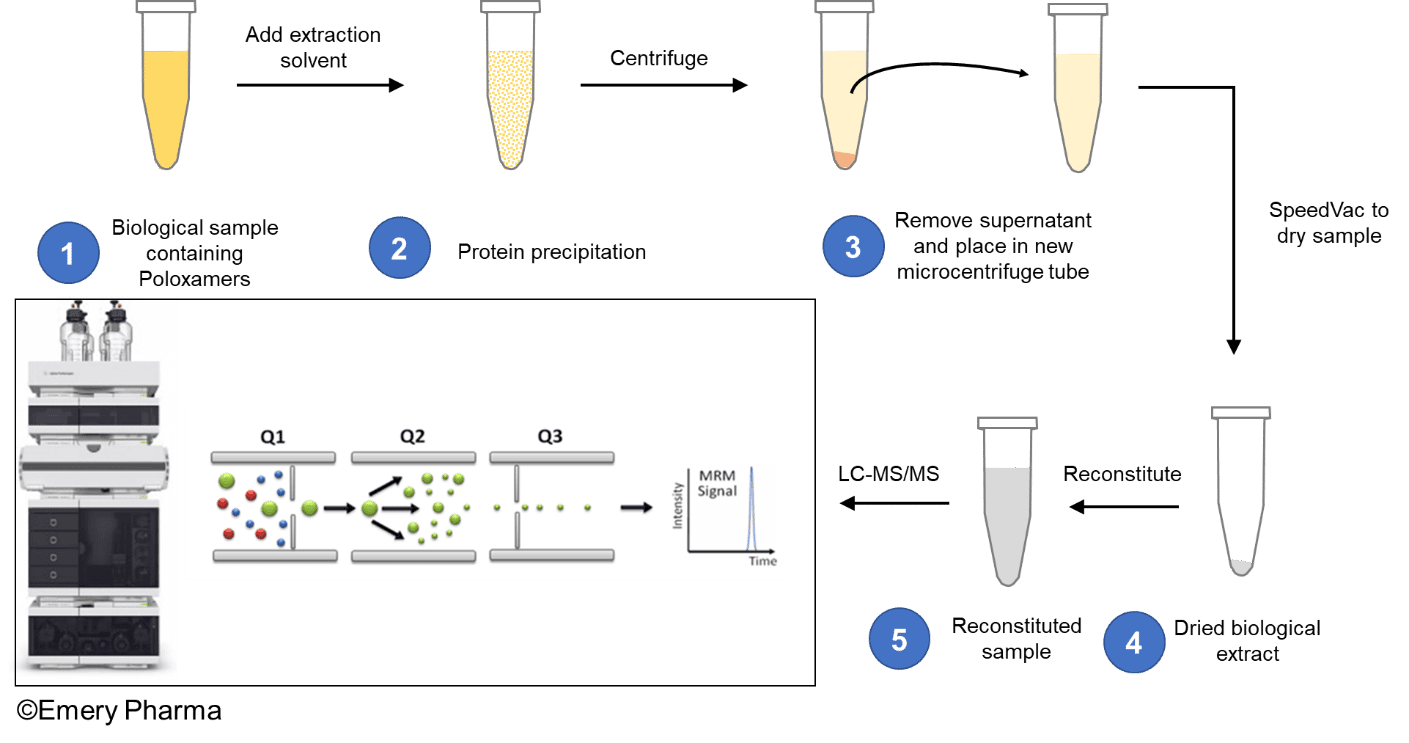
This LC-MS/MS method operating in the multiple reaction monitoring (MRM) mode, significantly improves the detection specificity, quantitation limits, and dynamic range for poloxamers in a variety of biological and pharmaceutical matrices.
In this method, a standard curve in the matrix of interest (with no endogenous poloxamer) was employed for the poloxamer quantification. The overall linear range of the method was established from 2.0 µg/mL/0.0002% (w/v) to 50.0 µg/mL/0.005% (w/v). Dynamic range can be further extended via pre-concentration of samples (depending on amount of sample availability) and/or dilution of samples with levels beyond 50.0 µg/mL.
The method's precision was evaluated based on independent biological replicates, and the overall coefficient of variation (%Cv) was found to be less than 15 - 25% depending on the background matrix. The method's accuracy was also evaluated based on different quality control (QC) samples within the method's linear range. The overall accuracy (% error) of the QC samples was found to be less than 15 - 25% depending on the background matrix.
Operating in the MRM mode improved the specificity and sensitivity of the method as it is able to remove background interference present in complex biological samples, such as plasma, serum, and cell products. The limit of detection (LOD) of the method was generally found to be 1.5 µg/mL/0.00015% (w/v), and the limit of quantitation (LOQ) was found to be 2.0 µg/mL/0.0002% (w/v) for a therapeutic cell product matrix (limits may vary depending on the matrix of interest).
LC-MS/MS analysis of poloxamer requires carefully optimization of the chromatographic conditions (column, mobile phase composition, operating temperature, injection volumes, etc.) to obtain acceptable chromatographic features, with minimal carry-over amenable to high throughput analysis. Additionally, it is also important to consider the mode of sample cleanup and type of microcentrifuge tubes used during sample preparation if accurate quantification of poloxamer at trace concentration level is desired.
The team at Emery Pharma has vast expertise in development and validation of assays for detection or quantification of poloxamers in trace levels. We are ready to discuss our experience and hear more about your project; for more information, please contact us at info@emerypharma.com.
About the author:
Ali (Al) Najafi, M.S., is a Research Scientist at Emery Pharma. His main expertise includes high-throughput analytical assay development for a wide range of small and large molecules in biological matrix using novel chromatographic and mass spectrometric techniques.
References:
- Hitesh R. Patel et al /Int.J. PharmTech Res. 2009,1(2)
- D. Ramya Devi et al /J. Pharm. Sci. & Res. Vol.5(8), 2013, 159 – 165
- Anaïs Pitto-Barry et al/Polym. Chem., 2014, 5, 3291-3297
- Houang et al. Skeletal Muscle (2018) 8:31
- M. Nair et al. / Journal of Pharmaceutical and Biomedical Analysis 41 (2006) 725–730
